Geography of Poverty in Lansing
Many of us are grappling with poverty in 2022. Here in the city of Lansing, we have a poverty rate of 22% (compared to the average of 11.9% in other metro areas). The 2020 census data has been rolling out, and poverty statistics around the country are available.
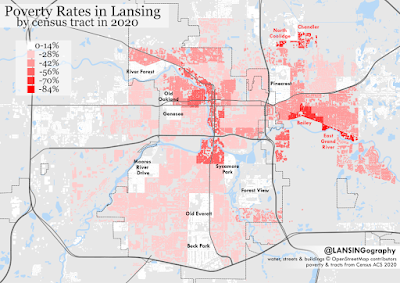
That poverty level of 22% is not distributed uniformly around the Red Cedar. Below you can see a visualization of poverty by census tract (one of the smallest divisions that the American Community Survey releases data for), and you can see certain neighborhoods are hit harder than others.
To probably no one's surprise, the highest rates of poverty are those experienced by students (mostly) temporarily in student-heavy places in East Lansing: East Grand River at 81%, and both Bailey and Chandler/North Coolidge at 68%.
Inside Lansing proper, a lot of the highest poverty areas are in the former redlined areas along the river: Fabulous Acres (43%) through Downtown and Old Town (42%) and North Walnut street area near the school for the blind (46%) all experiencing higher rates of poverty. (We've talked about redlining before here.)
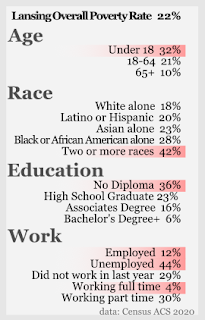
Also interesting is that, like most areas of the United States, different groups of people experience poverty at varying rates. Unsurprisingly, being employed offers some insulation against poverty. What might be surprising is that even being employed full-time didn't guarantee an income above the poverty level: 4% of people in Lansing worked full time for the last 12 months and still couldn't make ends meet.
There is a still value to having education: whether a high school diploma or college, a higher education level is correlated with a lower rate of poverty. There is still a spread between people of color and White people with the most pronounced difference between White people and people who self-identified as two or more races".
Who is ALICE?
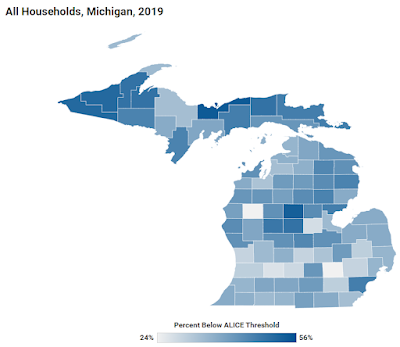
Research has suggested that even the federal poverty level doesn't accurately describe people in desperate financial situations: while 13% of people in Michigan are in poverty, another 25% of folks were ALICE: Asset Limited, Income Constrained, Employed. UnitedForAlice.org maintains a county-by-county record of people who are in this marginal category. They do not have city level information, but Michigan's counties look like this:
|
|
Total households |
In poverty |
Additional
Households below ALICE threshold |
|
Ingham |
114,534 |
15% |
27% |
|
Eaton |
44,420 |
6% |
23% |
|
Clinton |
30,070 |
9% |
21% |
Information in text below for text-to-speech readers:
|
Lansing Overall
Poverty Rate |
22% |
|
By age: |
|
|
Under 18 |
32% |
|
18-64 |
21% |
|
65+ |
10% |
|
By race: |
|
|
White alone |
18% |
|
Latino or Hispanic |
20% |
|
Asian alone |
23% |
|
Black or African
American alone |
28% |
|
Two or more races |
42% |
|
By education: |
|
|
No diploma |
36% |
|
High school graduate |
23% |
|
Associates degree |
16% |
|
Bachelor’s degree or
higher |
6% |
|
By work: |
|
|
Employed |
12% |
|
Unemployed |
44% |
|
Did not work in the
last year |
29% |
|
Worked full time last year |
4% |
|
Worked part time last
year |
30% |


No comments:
Post a Comment